
Italy Population 2018
population of Italy is estimated at 59.29 million according to the latest UN projections in 2018. The official Census figures are more optimistic, estimating the population at 61,838,227 in 2016. Italy, officially the Italian Republic, is located in Southern Europe and bordered by France, Slovenia, Austria and Switzerland along the Alps. This famously boot-shaped country is the 4th most populous country in Europe (after France, the United Kingdom, and Germany) and the 23th most populous in the world.
population of Italy density is very uneven and the Po Valley is the most densely populated with almost half of the country’s population. Other densely packed areas include the metropolitan areas of Naples and Rome. The Basilicata plateaus, the Alps and Apennines highlands, and the island of Sardinia have a very sparse population.
Italy Demographics
Italy experienced mass emigration from the end of the 19th century through the 1960s with nearly 750,000 Italians emigrating per year from 1898 to 1914. It’s thought that this is the largest mass migration in contemporary times and led to a diaspora of 25 million Italians. Today, over 5 million Italian-born people live abroad.
By the late 1970s, however, Italy began to attract a great deal of foreign immigrants. It’s estimated there are over 5 million foreign residents in Italy today, which accounts for 7.5% of the total population. This includes about 500,000 children born in Italy to foreign nationals.
Official figures for Italy’s population exclude illegal immigrants, as their numbers are hard to determine. Estimates place their numbers at 670,000 today, many of which are from Eastern Europe and North Africa. The number of illegal immigrants entering the company has increased by 43% in 2016, according to best estimates.
There are also close to 1 million Romanian citizens officially registered in Italy, followed by Moroccans and Albanians with a population of half a million each.
The largest ethnic group in Italy is the Native Italian, comprising 96% of the population.
Largest Cities in Italy
The three largest cities in Italy include Rome (2.8 million), Milan (1.3 million) and Naples (1 million), although Naples has experienced a population drop below 1 million in the last decade. Rome is Italy’s capital and home to 2.8 million people in 1,285 square kilometers (496 square miles), which makes it the 4th most populous city in the European Union within city limits. Its urban area is home to up to 3.8 million, and the Rome metropolitan area has a population of 4.2 million.
Rome has a rich history that spans over 2,500 years since it was founded in 753 BC. It’s one of the oldest continuously occupied cities on the continent and is often referred to as “the Eternal City.”
Milan, the fashion capital of the world, was first settled by Celts circa 400 BC, although it was eventually conquered by the Romans and became the capital of the Western Roman Empire. The city proper is home to 1.3 million people, but the urban area has a population of 5.2 million and is the 5th largest in the EU and the largest in the country. The Milan metropolitan region has a population of 8 million.
Italy Top 20 Cities by Population
| Name | Population |
| Rome | 2,318,895 |
| Milan | 1,236,837 |
| Naples | 959,470 |
| Turin | 870,456 |
| Palermo | 648,260 |
| Genoa | 580,223 |
| Bologna | 366,133 |
| Florence | 349,296 |
| Catania | 290,927 |
| Bari | 277,387 |
| Messina | 219,948 |
| Verona | 219,103 |
| Padua | 203,725 |
| Trieste | 187,056 |
| Brescia | 184,826 |
| Prato | 181,820 |
| Taranto | 181,082 |
| Reggio Calabria | 169,140 |
| Modena | 158,886 |
| Livorno | 153,773 |
Italy Population Growth
population of Italy is expected to decline throughout the 21st century with a death rate now greatly exceeding the birth rate. Latest indicators show 1,673 deaths per day, compared to just 1,353 births per day. Despire a positive net migration of 289 per day, the overall trend is now negative. Currently, Italy’s foreign residents are outpacing the country’s population growth with a foreign population that grew 7.4% in 2012, compared to a population growth of just 0.5%.
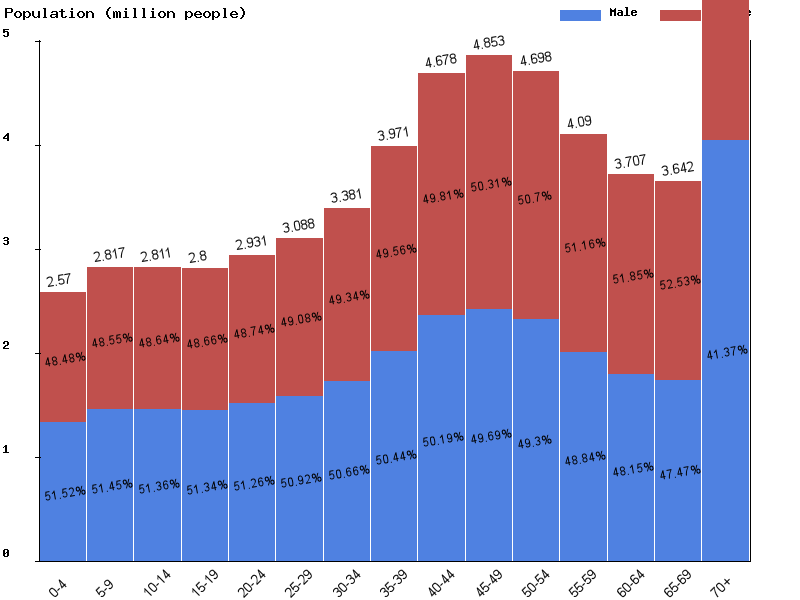
Italy is a rapidly aging country, and in 2014 a full 22% of its population was 65 or older, with just 13.5% under the age of 15.
population of Italy Clock
| The population of Italy (as of 7/2/2018) | 59,290,76 |
| Last UN Estimate (July 1, 2018) | 59,290,97 |
| Births Per Day | 1,353 |
| Deaths Per Day | 1,673 |
| Net Migrations Per Day | 289 |
Population: Overall total population (both sexes and all ages) in the country as of July 1 of the year indicated, as estimated by the United Nations, Department of Economic and Social Affairs, Population Division. World Population Prospects: The 2017 Revision. For forecasted years, the U.N. medium-fertility variant is used.
Density (P/Km²): (Population Density) Population per square Kilometer (Km²).
World Population: Total World Population as of July 1 of the year indicated.
Global Rank: Position held by Italy in the list of all countries worldwide ranked by population (from the highest population to the lowest population) as of July 1 of the year indicated.
Italy Population by Year (historical)
| Year | Population | % Male | % Female | Density (km²) | World Population | Global Rank
|
| 2018 | 59290.97 | 0.49 | 0.51 | 196.76 | 7,632,819,325 | 23 |
| 2017 | 59359.90 | 0.49 | 0.51 | 196.99 | 7,550,262,101 | 23 |
| 2016 | 59429.94 | 0.49 | 0.51 | 197.22 | 7,466,964,280 | 23 |
| 2015 | 59504.21 | 0.49 | 0.51 | 197.47 | 7,383,008,820 | 23 |
| 2010 | 59729.81 | 0.49 | 0.51 | 198.22 | 6,958,169,159 | 23 |
| 2005 | 58808.48 | 0.49 | 0.51 | 195.16 | 6,542,159,383 | 22 |
| 2000 | 57293.72 | 0.49 | 0.51 | 190.13 | 6,145,006,989 | 22 |
| 1995 | 57255.19 | 0.49 | 0.51 | 190.00 | 5,751,474,416 | 22 |
| 1990 | 57127.12 | 0.49 | 0.51 | 189.58 | 5,330,943,460 | 17 |
| 1985 | 57012.35 | 0.49 | 0.51 | 189.20 | 4,873,781,796 | 14 |
| 1980 | 56419.28 | 0.49 | 0.51 | 187.23 | 4,458,411,534 | 13 |
| 1975 | 55330.69 | 0.49 | 0.51 | 183.62 | 4,079,087,198 | 14 |
| 1970 | 53578.68 | 0.49 | 0.51 | 177.80 | 3,700,577,650 | 13 |
| 1965 | 51728.66 | 0.49 | 0.51 | 171.66 | 3,339,592,688 | 11 |
| 1960 | 49742.20 | 0.49 | 0.51 | 165.07 | 3,033,212,527 | 10 |
| 1955 | 48372.84 | 0.49 | 0.51 | 160.53 | 2,772,242,535 | 10 |
Italy Sex ratio
Italy Population by Year (Projections)
| Year | Population | % Male | % Female | Density (km²) | Global Rank
|
| 2020 | 59132.07 | 0.49 | 0.51 | 196.23 | 24 |
| 2025 | 58623.03 | 0.49 | 0.51 | 194.54 | 26 |
| 2030 | 58109.92 | 0.49 | 0.51 | 192.84 | 28 |
| 2035 | 57534.36 | 0.49 | 0.51 | 190.93 | 30 |
| 2040 | 56872.17 | 0.49 | 0.51 | 188.73 | 31 |
| 2045 | 56071.39 | 0.49 | 0.51 | 186.08 | 34 |
| 2050 | 55093.19 | 0.49 | 0.51 | 182.83 | 36 |
| 2055 | 53933.32 | 0.49 | 0.51 | 178.98 | 41 |
| 2060 | 52685.58 | 0.49 | 0.51 | 174.84 | 42 |
| 2065 | 51505.78 | 0.49 | 0.51 | 170.92 | 46 |
| 2070 | 50532.92 | 0.50 | 0.50 | 167.70 | 47 |
| 2075 | 49820.74 | 0.50 | 0.50 | 165.33 | 48 |
| 2080 | 49325.04 | 0.50 | 0.50 | 163.69 | 50 |
| 2085 | 48936.73 | 0.50 | 0.50 | 162.40 | 49 |
| 2090 | 48574.83 | 0.50 | 0.50 | 161.20 | 50 |
| 2095 | 48205.30 | 0.50 | 0.50 | 159.97 | 50 |
References: